Technology
Imaging and analysis
How the box images grain, why it uses ultraviolet light, and how the quality models work.
Why ultraviolet
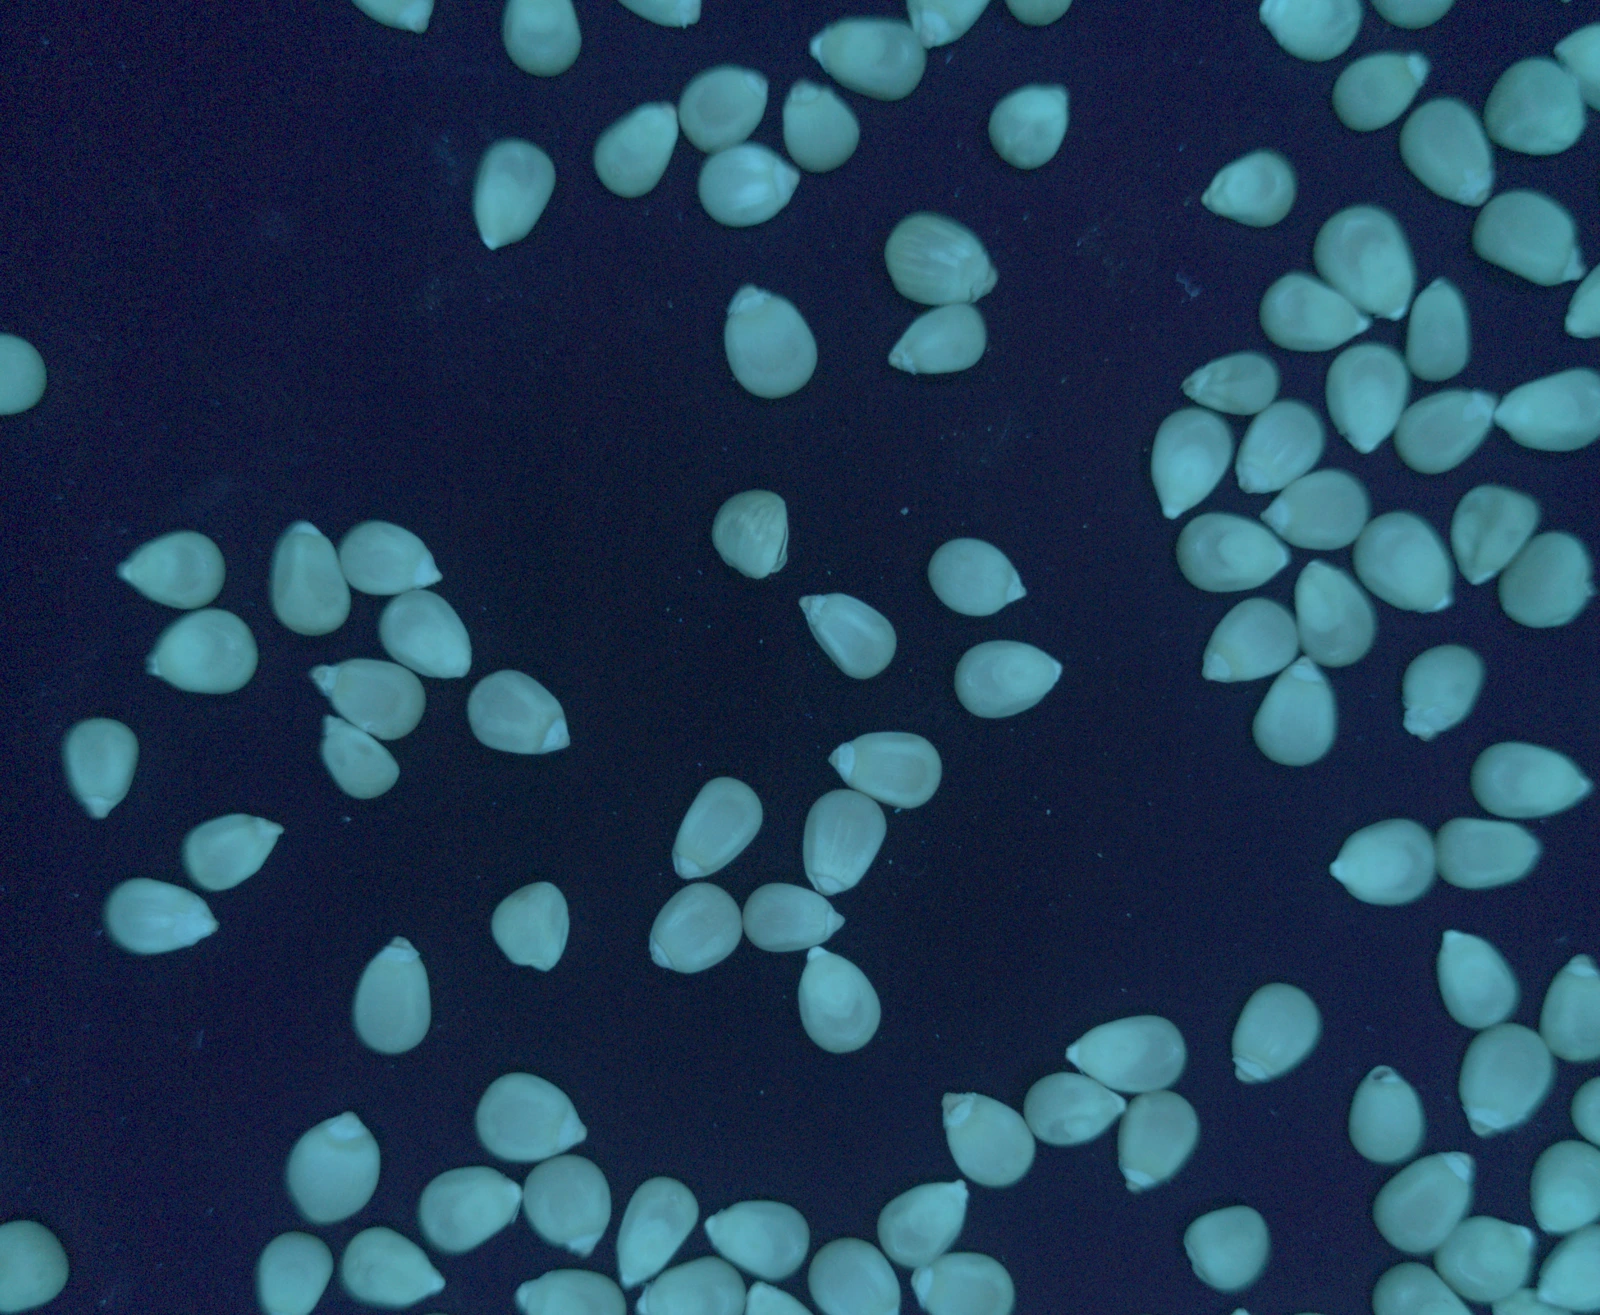
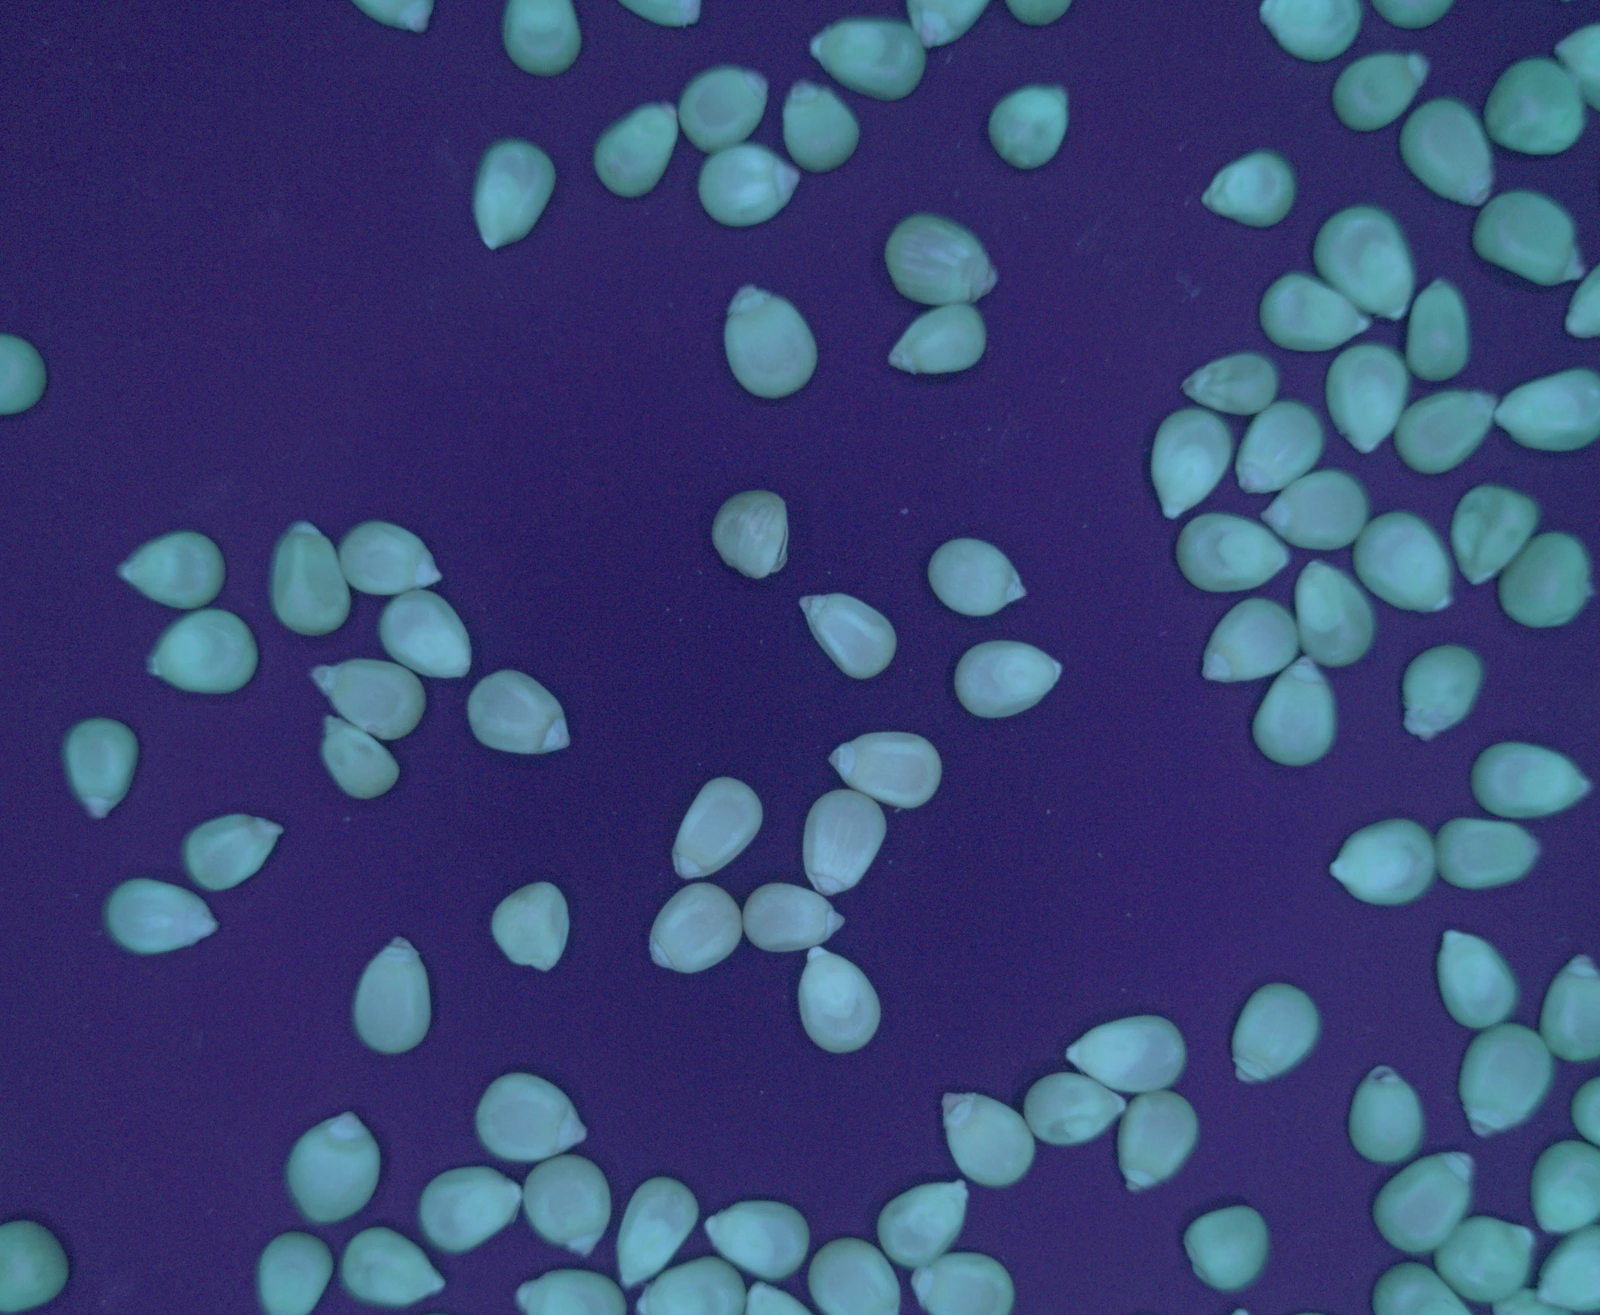
Under ultraviolet light, some materials in or on grain absorb the UV and emit light at a longer wavelength. This is fluorescence, and a camera can record it even when kernels look ordinary in white light. The box images every sample under two UV bands, 365 nm and 385 nm, alongside a white-light image.
Background: UV screening of maize
Grain inspection has long used UV lamps as a screening aid. Under 365 nm light, maize kernels with a bright greenish-yellow fluorescence (BGYF) are a recognised warning sign for Aspergillus flavus, the mould that can produce aflatoxin. The AACC method that describes this calls it a presumptive test: it suggests where to look, and only a laboratory analysis confirms aflatoxin. Many kernels fluoresce for other reasons, so fluorescence alone cannot establish contamination.
Capture
Every image is taken inside the closed box, so room light does not reach the sample, with one lamp on per image. The box calibrates itself, so tests stay comparable from one day to the next.
Quality models
On the box, the models find each kernel in the images, identify its crop, and grade it with a quality model made for that crop.
- Imageswhite light, 365 nm, 385 nm
- Find kernelseach kernel on its own
- Identify cropmaize, rice, wheat, sorghum
- Gradeeach kernel's quality
- Resultscreen and dashboard
Crops
The crop model recognises maize, rice, wheat and sorghum. A kernel it is not confident about is reported as unknown rather than assigned to one of the four.
Each crop has its own quality model. The table shows which quality classes are graded for each crop.
| Quality class | Maize | Rice | Wheat | Sorghum |
|---|---|---|---|---|
| Normal | Yes | Yes | Yes | Yes |
| Broken | Yes | Yes | Yes | Yes |
| Mouldy | Yes | Yes | Yes | Yes |
| Sprouted | Yes | Yes | Yes | Yes |
| Attacked by pests | Yes | Yes | Yes | Yes |
| Fusarium and shrivelled | Yes | Yes | Yes | Yes |
| Heat-damaged | Yes | No | No | Yes |
| Unripe | No | Yes | No | No |
| Black point | No | No | Yes | No |
| Impurity (stones, clods, other debris) | Yes | Yes | Yes | Yes |
How the models improve
Boxes receive model updates over the air, and the models run on the box, so a test doesn't wait for a connection.
Adding a crop
Building new quality models is the core of what Aflabox does. Any grain or crop can be added once there is enough labelled training data for it, and new quality classes can be added the same way.
The same applies to how results are scored. Today each kernel is graded against fixed quality classes. We are building scoring that measures a sample against a buyer's or user's own quality requirements, not only a fixed grade. If you work with a crop or a specification we don't cover yet, tell us about it.
Evidence
Sources for the figures used on this site.
- Eskola M. et al. (2020). Worldwide contamination of food-crops with mycotoxins: Validity of the widely cited 'FAO estimate' of 25%. Critical Reviews in Food Science and Nutrition 60(16):2773–2789. doi.org/10.1080/10408398.2019.1658570
- Hoffmann V., Ndisio B., Barasa A., Okoth S., Murphy M. (2025). Aflatoxin contamination of maize flour in Kenya: Results from multi-city, multi-round surveillance. PLOS ONE. doi.org/10.1371/journal.pone.0336687
- Liu Y., Wu F. (2010). Global burden of aflatoxin-induced hepatocellular carcinoma: a risk assessment. Environmental Health Perspectives 118(6):818–824. doi.org/10.1289/ehp.0901388
- Johansson A.S., Whitaker T.B. et al. (2000). Testing shelled corn for aflatoxin, Part I: estimation of variance components. Journal of AOAC International 83(5):1264–1269. PMID 11048871. pubmed.ncbi.nlm.nih.gov/11048871/
- Chavez R.A., Cheng X., Stasiewicz M.J. (2020). A review of the methodology of analyzing aflatoxin and fumonisin in single corn kernels and the potential impacts of these methods on food security. Foods 9(3):297. doi.org/10.3390/foods9030297